Comparing Habs D-man Jeff Petry's New Deal to Other NHL Defencemen
- Ken Beckett

- Sep 26, 2020
- 4 min read

On Friday, Montreal Canadiens general manager Marc Bergevin announced that the club had signed defenceman Jeff Petry to a four-year deal worth $6.25M annually, with the deal set to kick in at the start of the 2021-22 season.
There is no doubt that Petry has been a solid defenceman over his six seasons with the Habs. Especially so during the last three years, as Petry is one of six defenceman alongside Brent Burns, Roman Josi, Alex Pietrangelo, Victor Hedman, and John Carlson to have scored over ten goals and amassed over 40 points during that span.
Aside from goals and points, how does his game look from an analytical perspective when compared to other defencemen who made a similar salary of around 6.25M during the 2019-20 season? For this, I compiled a list of defencemen of Pietrangelo, Ryan Ellis, Ivan Provorov, Ryan McDonagh, Cam Fowler, Mark Giordano, and Keith Yandle, who all had cap hits of between 6.25M (Ellis) and 6.75M (Giordano) according to CapFriendly.
Individual Expected Goals

As we can see from this chart, Petry was in the top three for expected goals in this group of eight defencemen, trailing only Provorov and Pietrangelo, who not only had higher expected goal totals but actual goal totals. Petry did exceed his expected goal totals by scoring 11 this past season after scoring 13 goals last year and potting 12 two years prior. His lower expected goal totals this season could also be correlated to shooting percentage and where Petry shoots from more often than not on the ice as detailed below.
Shot Location

The above shot chart courtesy of EvolvingHockey.com shows the majority of Petry's shots come from the right point along the blue line, which has a range of expected goal values from 1-5% depending on the shot and location.This is especially true of 5-v-5 situations where most of his shots come from the right point.

Shooting Percentage

As a result, we see Petry in the middle of the pack when it comes to shooting percentage among the group of eight similarly paid defencemen. These numbers can be a bit deceiving though as Petry recorded the second most individual shots for of the group with 158, trailing St. Louis Blues captain and pending UFA Alex Pietrangelo and his 225 shots.
On a more macro level, how does Petry's play affect his team and how does that compare to this group of eight? For that, we examine EvolvingHockey.com's xGAR model, which is a "table is based on the idea that a team's goal differential can be broken down to four components: Shot Rates, Shot Quality, Shooting, and Goaltending." Additionally, GAR or Goals Above Replacement, is an analytical tool that "attempts to assign a total value to each player, which represents how much that player contributed to their team in a single number. This single number is comprised of multiple components that are ratings for each area of play within a given sport."
xGAR vs. GAR


Based on his play, Petry's xGAR ranks second behind Pietrangelo, but as we can see, there is a dip to the middle of the pack when we look at actual GAR. This could be due to many factors including mistakes or a poor play by Petry, his defensive partner, or one of the forwards he was on the ice with at the time. This is a likely outcome given the Habs' regular season performance, finishing fifth in their division and 12th overall in the Eastern Conference.
Finally, another analytical tool to evaluate overall play is GSVA, which stands for Game Score Value Added. Created by Dom Luszczyszyn of The Athletic, GSVA puts a quantitative value on a player's worth in lineup, factoring in the following variables:
Goals: 0.75
Primary Assists: 0.7
Secondary Assists: 0.55
Shots: 0.075
Blocks: 0.05
Penalty Differential: 0.15
Faceoff Differential: 0.01
5-on-5 Corsi Differential: 0.05
5-on-5 Goal Differential: 0.15
2019-20 GSVA
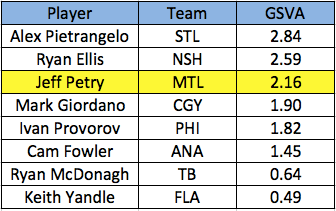
The figure above clearly shows Petry as one of the leaders in GSVA among this group of eight comparably paid defencemen, trailing only Pietrangelo who is set for a massive payday this off-season, and Preds defenceman Ryan Ellis who is set to have the same cap hit of $6.25M for the next seven seasons.
In fact, Petry's 2.16 GSVA during the 2019-20 season is the same as Mitch Marner and Ryan Nugent-Hopkins, and .01 point below Alex Ovechkin who finished with a 2.17 game score value added.
Summary
These analytics clearly show that Jeff Petry has been excellent for the Montreal Canadiens and the pay raise was deserved as he is among the leaders in this group of eight defencemen. In fact, with a cap hit of $5.5M this past season and next, Petry will be an underrated bargain for the Habs if he can continue to produce at these levels next season. Beyond that, this looks like a good deal for both the team and the player as he produces at a level consistent with other defencemen who make that amount. This deal could also look like a bargain down the road if Petry continues to produce at this level while other rearguards like Pietrangelo and others get raises.
Analytics courtesy: EvolvingHockey.com and Dom Luszczyszyn of The Athletic

Comments